Temperature Log Example
This example describes how to store sensor data and process it on the computer. We are going to read environment temperature and save the values on a microSD card. After this we will connect the microSD card to the computer and analyze the obtained temperature values.
Required hardware #
- Arduino Uno board
- TMP36 analog temperature sensor
- microSD breakout board
- Formatted microSD card
- Breadboard
- Hook-up wires
Circuit #
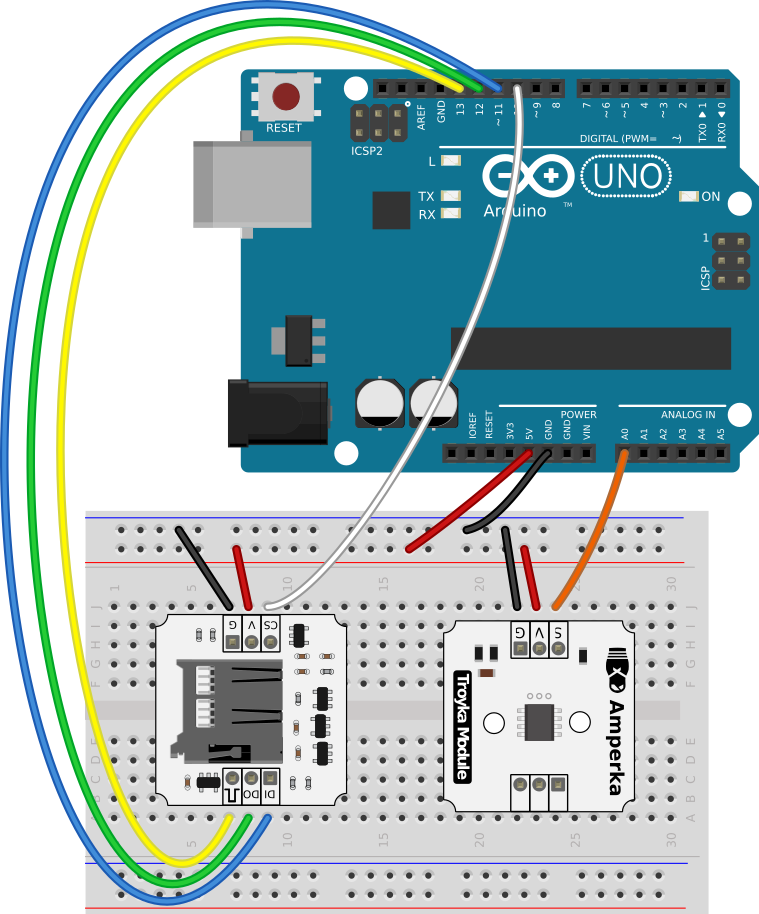
- The analog thermometer is connected to the
A0analog port on the Arduino board. - The microSD breakout boards usually use an SPI interface to communicate. Arduino Uno provides SPI on pins
11,12, and13. TheCSpin can be connected to an arbitrary digital pin. We chose10.
Programming #
Create a new project in XOD and name it something like temparature-log.
Source data #
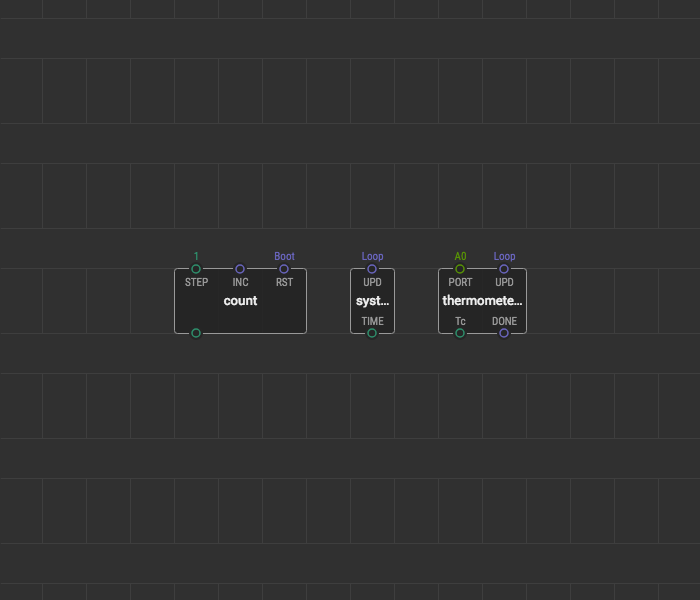
- As we use the TMP36 based thermometer we add a
thermometer-tmp36to the patch. This thermometer should be connected to an analog Arduino port. We connected our sensor toA0, so set thePORTpin value toA0. - Next, we want to bind the temperature to a timestamp when it was read. For this place a
system-timenode. This node outputs time in seconds passed since the program start. - If we want to update the data continuously we’d better number each new record. The
countnode will do it for us. Place it onto the patch and set theSTEPvalue to 1.
By now we have three data sources on the patch.
Limit frequency #
We need to set a frequency of readings to limit the data volume and to give some time for the microSD board to flush the file after each record. The easiest way to do this is to use a clock node. Place it onto the patch and link with all three data sources.
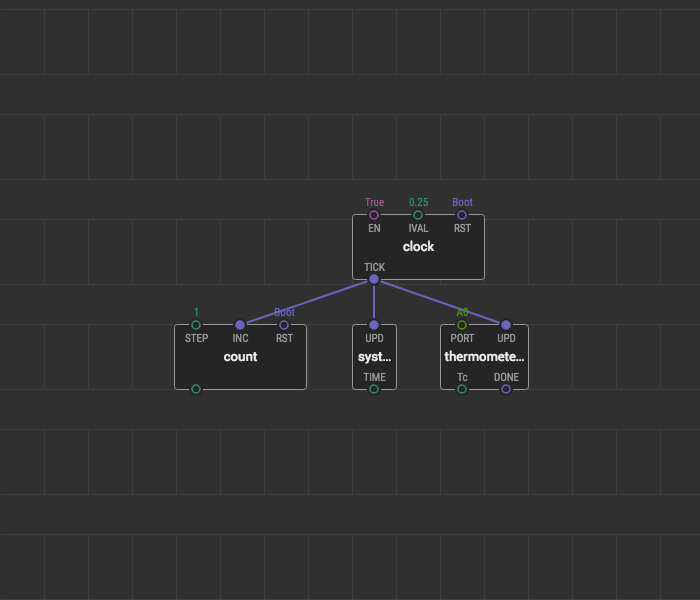
The IVAL pin is responsible for the pulse generation frequency and, as a consequence, for extracting a new set of data. We decided to receive and record data 4 times per second, so we set IVAL value to 0.25 (=¼).
Format data #
We predict lots of data. For easier processing it is a good idea to format it as a table. Each row may represent a single record: the record number, record timestamp, and a temperature value read at that moment. To combine all data values and store them as a single string, use the join node. Place join onto the patch and link it with all data sources.
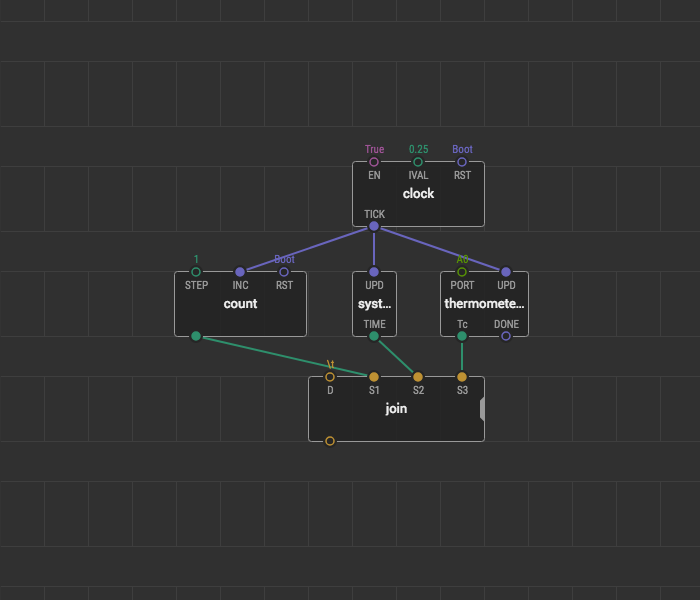
The D pin of the join node is used to delimit the values. With this pin you can set the a character or string you want to delimit the values.
There are numerous text-based formats for storing and exchanging data. The examples of such formats are CSV (Comma-Separated Values) or TSV (Tab-separated values). These text formats are used to store tabular data and to exchange it between different computer programs. Notably, spreadsheet applications such as Google Spreadsheets, Microsoft Excel, LibreOffice Calc can easily import such files. Look at a CSV file example which defines track durations for a music album:
No.,Title,Length
1,Hells Bells,5:12
2,Shoot to Thrill,5:17
3,What Do You Do for Money Honey,3:35
4,Givin’ the Dog a Bone,3:31
5,Let Me Put My Love into You,4:15
6,Back in Black,4:15
7,You Shook Me All Night Long,3:30
8,Have a Drink on Me,3:58
9,Shake a Leg,4:05
10,Rock And Roll Ain’t Noise Pollution,4:15
So, let’s use the TSV text-format for storing. To delimit the values with tabs place the \t character into the D pin of the join node. The backslash-t is a special escape-sequence to denote the TAB character because it can’t be easily printed and displayed in IDE.
Store data #
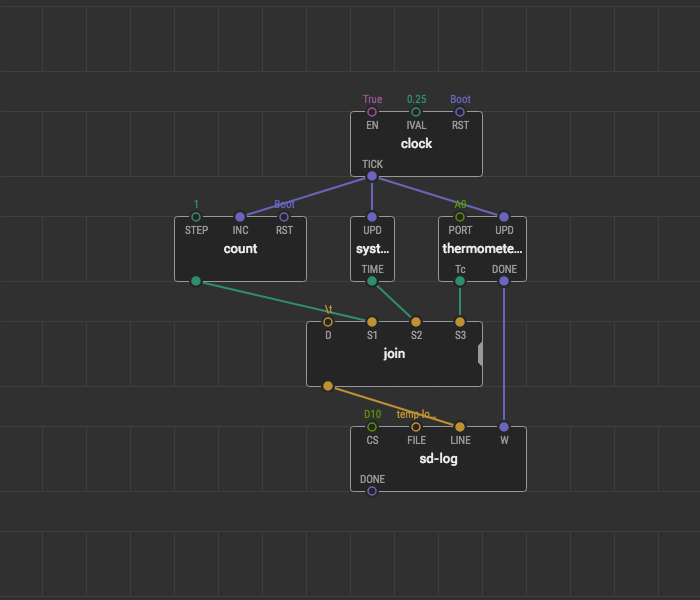
XOD provides an sd-log node to append text lines to the tail of the specified file stored on an SD card. Add the sd-log node onto the patch and set up its inputs:
- Link its
LINEpin with thejoinoutput. - The
CSpin is used to set up the number of the chip select pin of the SPI interface on the Arduino board. In this example it isD10. - The
FILEpin points to a particular file on the microSD card. Let’s name our data filetemp-log.txt. - The
Wpin triggers a new write. Connect it with theDONEpin of the thermometer. With this link thesd-logmakes a new record only when a new temperature value appears.
Here is the resulting program patch.
Measure temperature #
Upload the program to your board and optionally power it through a battery. You may connect and disconnect the device from the power source as many times as you wish. On every boot the log will be continued, so the data from previous sessions won’t be lost.
The ambient temperature changes slowly. To test the logger we force faster changes: we cool the thermometer in a fridge and heat it with a dryer.
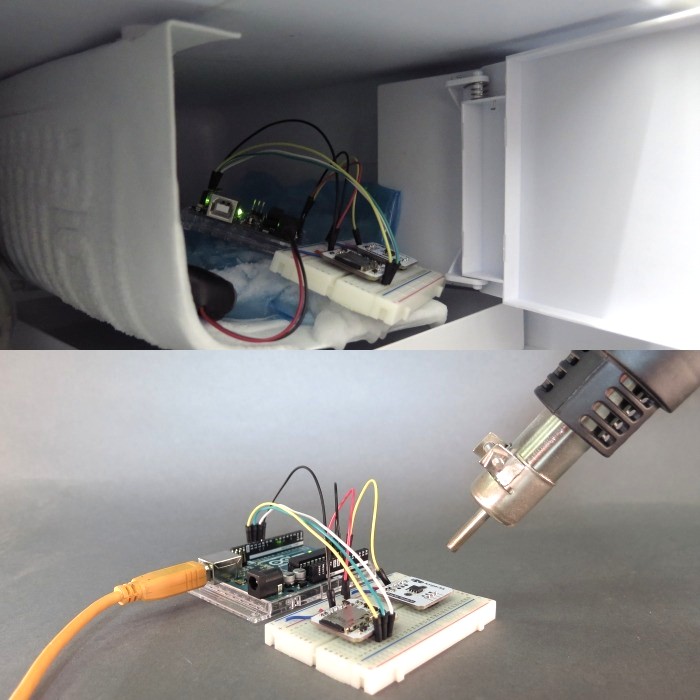
When enough data is collected, take off the microSD card.
Analyze data #
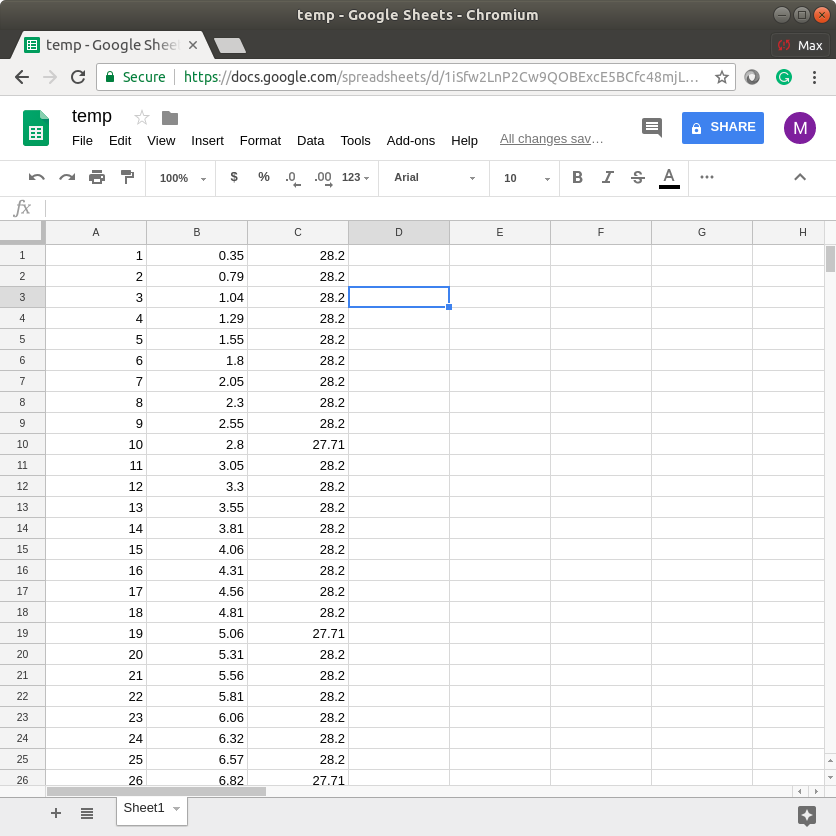
Open the temp-log.txt file on your computer to see what is inside.
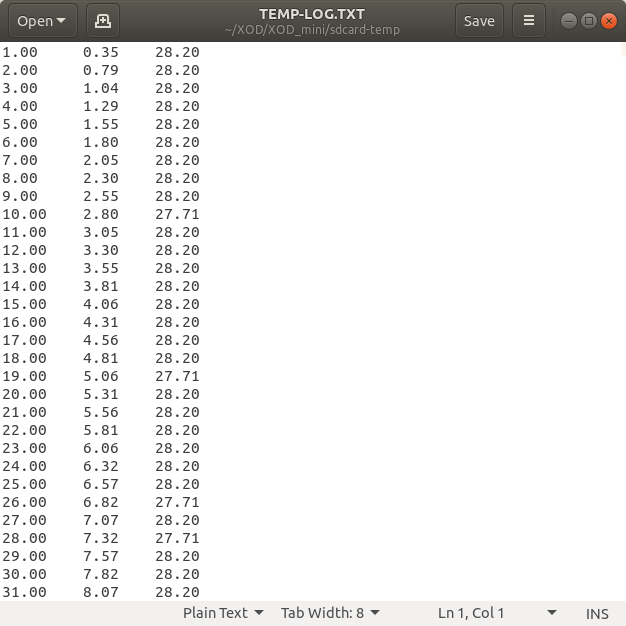
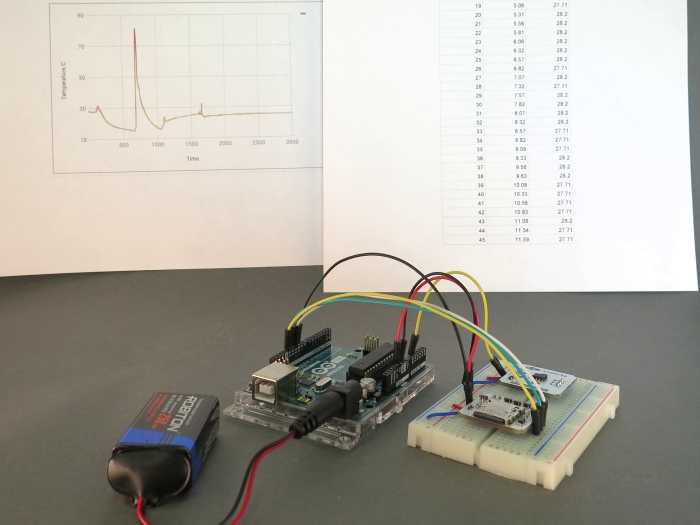
As you see, we’ve got a table with three columns and many rows. One row is for a single sample. The first column stores the record number (just ignore the 00 fraction part), the second column is the time value in seconds, and the last one is the actual temperature in Celsius. You may use various applications to analyze the data. For our example, let’s use Google Spreadsheets.
You can move data values to the spreadsheet in different ways:
- Select all the data from the
temp-log.txtfile by pressing CTRL+A in your text editor. Copy what you’ve selected by pressing CTRL+C. Create a new Google Spreadsheet document, select the first cell in the table and press CTRL+V. - Create a new Google Spreadsheet document. Hit
File -> Import.. -> Upload. Select thetemp-log.txtfile from the microSD card or drag-and-drop it into the field. Select theTabseparator type and import the data.
Once you input the data, you can visualize it.
- Create a blank chart by hitting
Insert -> Chart. - Choose the
Chart type. We chose theSmooth line chart. - Edit the
X-AXISand choose the time column as data. - Edit the
SERIESand choose the temperature column as data. - Hit
CUSTOMIZE -> Chart & axis title. - Input the titles for the vertical and horizontal axes. We named them
Temperature, CandTime. - Set the minimum and maximum bounds for the vertical and horizontal axes. We set the
(10,90)bound for theTemperature, Caxis and(0,3000)for theTimeaxis. - You can change the color of the line by hitting
Seriesand choosing the color.
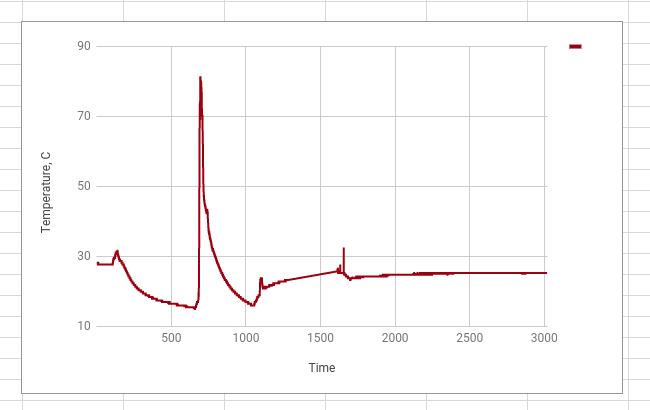
On the graph, you can clearly see the temperature change after our manipulations with the thermometer.
If you have got problems trying to repeat the guide, download the prepared project and open it in the IDE.
Conclusion #
With the microSD card, you can store a significant amount of data that can not be stored in the memory of the controller. You can use any other sensor or even several different sensors to log and observe a physical process of your choice.
To improve a logger and get notifications about occurred errors, use has-error node linked between the DONE output and the LUM input pin of the led node.